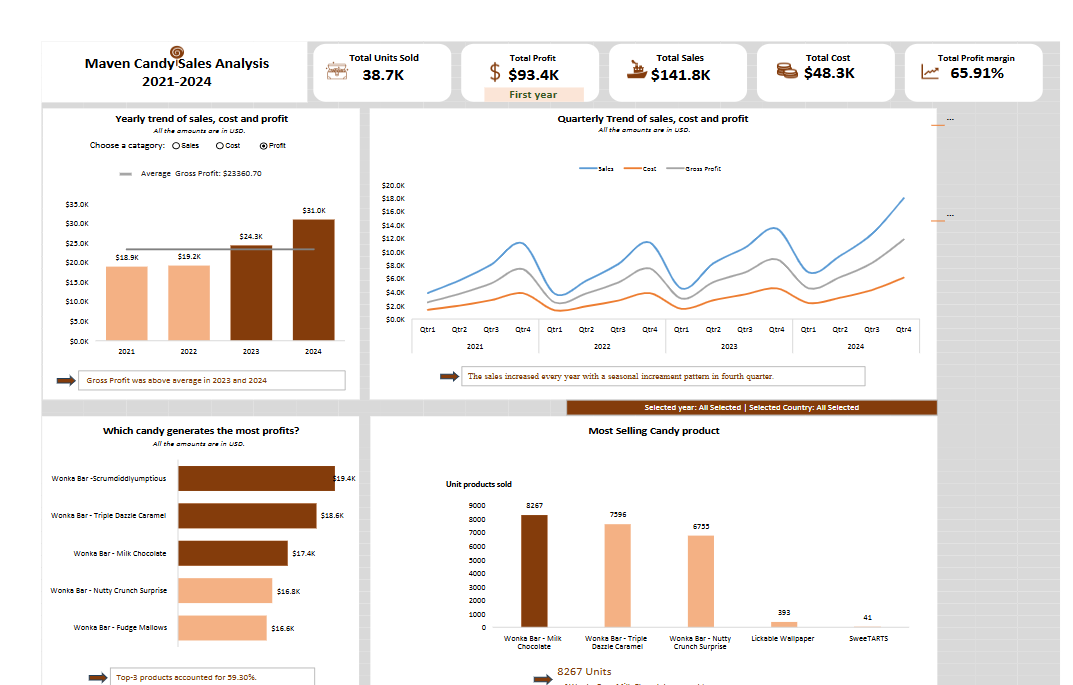
This project was a comprehensive data visualization coursework where I created a dynamic dashboard for dummy coffee sales data, applying all major visualization theories including Tufte's visualization principles and Gestalt principles to make the dashboard more effective and intuitive.
The project encompassed the entire data analytics pipeline - from raw data preprocessing and cleaning to the development of interactive dashboards that provide clear, actionable insights for business decision-making. The focus was on creating visualizations that not only looked professional but also effectively communicated complex data patterns to stakeholders.